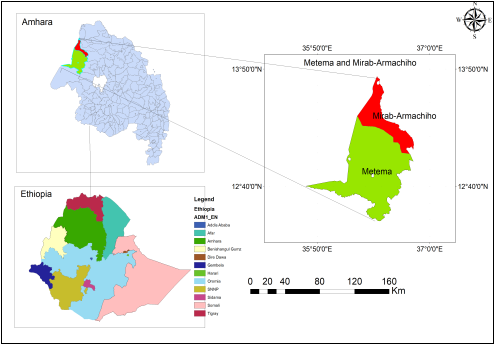
The poor agronomic practices, such as seeding rate and inappropriate plant population are the major reasons for low productivity of soybean. A field study did to determine the appropriate row and plant spacings for Soybean productivity and profitability at Metema and west Armachiho districts. Treatments were arranged to five rows (30, 40, 50, 60 and 70 cm) with three plant spacings (5, 10 and 15 cm) comparing with the blanket recommendation (40 cm x 10 cm and 60 cm x 5 cm) and laid out in randomized complete block design with three replications. The Afgat variety was used as planting material and 121 kgha-1 of NPS fertilizer was applied at sowing time. The combined results indicated that; days to 50% flowering, number of branches plant-1, length of productive node, number of seeds pod-1were significant, whereas days to 90% physiological maturity, plant height, number of pods plant-1, hundred seeds weight and grain yield were highly significant (p < 0.01) and affected by the interaction effects of inter and intra row spacings. The highest grain yield (3831 kgha-1) and net benefit (50,650 ETB/ha) were obtained from the combination of 40 cm row spacing with the 5 cm plant spacing. Whereas, the blanket recommendation (40 cm x 10 cm and 60 cm x 5 cm) gave 3556 kgha-1and 3519 kgha-1, respectively. Therefore, 40 cm the row with 5 cm plant spacing is suggested to be promoted for Soybean production on the low land areas of northwestern Gondar, Ethiopia.
| Published in | International Journal of Biochemistry, Biophysics & Molecular Biology (Volume 10, Issue 2) |
| DOI | 10.11648/j.ijbbmb.20251002.11 |
| Page(s) | 24-32 |
| Creative Commons |
This is an Open Access article, distributed under the terms of the Creative Commons Attribution 4.0 International License (http://creativecommons.org/licenses/by/4.0/), which permits unrestricted use, distribution and reproduction in any medium or format, provided the original work is properly cited. |
| Copyright |
Copyright © The Author(s), 2025. Published by Science Publishing Group |
Afgat, Interaction, Competition, Lowland, Net Benefit
TRT | DF | DM | ||||
|---|---|---|---|---|---|---|
Row Spacings (cm) | Plant spacings (cm) | |||||
5 | 10 | 15 | 5 | 10 | 15 | |
30 | 50 | 51 | 51 | 91 | 96 | 96 |
40 | 51 | 51 | 51 | 99 | 97 | 97 |
50 | 51 | 51 | 51 | 96 | 97 | 98 |
60 | 52 | 52 | 52 | 97 | 99 | 99 |
70 | 52 | 52 | 52.1 | 98 | 99 | 100 |
Mean | 51.4 | 97.3 | ||||
CV (%) | 13 | 11 | ||||
LSD (0.05) | 0.69* | 1.0** | ||||
TRT | NBPP | PH | LPN | ||||||
|---|---|---|---|---|---|---|---|---|---|
Row Spacings (cm) | Plant spacings (cm) | ||||||||
5 | 10 | 15 | 5 | 10 | 15 | 5 | 10 | 15 | |
30 | 3.9 | 4.0 | 4.6 | 92 | 92 | 89 | 71 | 69 | 67 |
40 | 5.2 | 5.1 | 4.3 | 93 | 90 | 87 | 72 | 68 | 67 |
50 | 5.2 | 5.1 | 5.2 | 92 | 90 | 88 | 71 | 68 | 68 |
60 | 5.2 | 5.9 | 5.5 | 88 | 90 | 91 | 71 | 68 | 69 |
70 | 4.6 | 5.6 | 5.7 | 92 | 90 | 85 | 68 | 69 | 66 |
Mean | 5 | 90 | 68.8 | ||||||
CV (%) | 19 | 8.3 | 11 | ||||||
LSD (0.05) | 0.76* | 4.2** | 4.2* | ||||||
TRT | NPPP | NSPP | HSW | ||||||
|---|---|---|---|---|---|---|---|---|---|
Row Spacings (cm) | Plant spacings (cm) | ||||||||
5 | 10 | 15 | 5 | 10 | 15 | 5 | 10 | 15 | |
30 | 38 | 48 | 54 | 2.57 | 2.78 | 2.74 | 14.8 | 14.8 | 14.6 |
40 | 73 | 58 | 63 | 2.83 | 2.80 | 2.79 | 15.2 | 14.9 | 14.8 |
50 | 71 | 66 | 68 | 2.82 | 2.76 | 2.72 | 14.9 | 14.5 | 14.6 |
60 | 58 | 69 | 68 | 2.78 | 2.82 | 2.76 | 15.2 | 14.8 | 14.9 |
70 | 60 | 70 | 68 | 2.77 | 2.73 | 2.71 | 15.0 | 14.9 | 14.0 |
Mean | 58.9 | 2.75 | 14.85 | ||||||
CV (%) | 11 | 10 | 5.5 | ||||||
LSD (0.05) | 9.2** | 0.16* | 0.04** | ||||||
Treatment | Grain Yield (kgha-1) | ||
|---|---|---|---|
Plant spacings (cm) | |||
Row spacings (cm) | 5 | 10 | 15 |
30 | 3338 | 3593 | 3375 |
40 | 3831 | 3756 | 3553 |
50 | 3545 | 3517 | 3436 |
60 | 3519 | 3739 | 3419 |
70 | 3532 | 3527 | 3205 |
Mean | 3514.2 | ||
CV (%) | 13 | ||
LSD (0.05) | 329** | ||
Treatment (cm) | UAGY (kg/ha) | AGY (kg/ha) | TVC (ETB) | GB (ETB) | NB (kg/ha) | Dominance |
|---|---|---|---|---|---|---|
40×5 | 3831 | 3448 | 18317 | 68967 | 50650 | |
50×5 | 3445 | 3101 | 19169 | 62018 | 42849 | D |
70×5 | 3532 | 3179 | 19671 | 63585 | 43914 | D |
30×5 | 3338 | 3004 | 19773 | 60080 | 40307 | D |
60×5 | 3517 | 3165 | 20372 | 63355 | 42983 | D |
40×10 | 3756 | 3380 | 22001 | 67617 | 45616 | |
30×10 | 3593 | 3234 | 24835 | 64683 | 39848 | D |
50×10 | 3517 | 3165 | 28695 | 63315 | 34620 | D |
60×10 | 3539 | 3185 | 30045 | 63711 | 33666 | D |
30×15 | 3375 | 3038 | 32737 | 60758 | 28021 | D |
40×15 | 3553 | 3198 | 33363 | 63963 | 30600 | D |
70×10 | 3527 | 3174 | 33446 | 63495 | 30049 | D |
50×15 | 3436 | 3092 | 39347 | 61840 | 22493 | D |
60×15 | 3419 | 3077 | 41834 | 61550 | 19716 | D |
30×5 | 3205 | 2885 | 47236 | 57698 | 10462 | D |
AGY | Adjusted Grain Yield |
cm | Cent Meter |
CV (%) | Coefficient of Variation |
DF | Days to 50% Flowering |
DM | Days to 90% Physiological Maturity |
D | Dominance |
ETB | Ethiopian Birr |
GFB | Gross Field Benefit |
LSD (%) | Least Significant Difference |
LPN | Length of Productive Node |
kg | KILO GRAM |
ha | Hectare |
PH | Plant Height |
NBPP | Number of Branches per Plant |
NPPP | Number of Pods per Plant |
NSPP | Number of Seeds per Pod |
ND | Non- Dominated |
Ns | Non-Significant |
GY | Grain Yield |
TVC | Total Variable Cost |
TRT | Treatment |
HSW | Hundred Seeds Weight |
UAGY | Unadjusted Grain Yield |
% | Percentage |
** | Highly Significant |
* | Significant |
| [1] | Shea, Z., Singer, W. M. and Zhang, B., 2020. Soybean production, versatility, and improvement. In Legume Crops-Prospects, Production and Uses. London, UK: Intech Open. |
| [2] | POPOVIC Vera, MILADINOVIĆ J., MALEŠEVIĆ M., MARIĆ V., ŽIVANOVIĆ Lj. (2013): Effect of agro-ecological factors on variations in yield, protein and oil contents in soybean grain. Romanian Agricultural Research, Nardi Fundulea, Romania. No. 30, DII 2067-5720 RAR 207. |
| [3] |
USDA. (2023b). World Agricultural Production. Available online at
https://apps.fas.usda.gov/psdonline/circulars/production.pdf |
| [4] | Amare Belay (1987). Research Program of IAR (Institute of Agricultural Research). Addis Ababa, Ethiopia. |
| [5] | NSRL (National Soybean Research Laboratory) (2007) Soybean Nutrition. National Soybean Research Laboratory, USA. |
| [6] | CSA (Central Statistics Agency), 2018. Area and production of major crops Central Statistics, Government of Ethiopia. |
| [7] | CSA (Central Statistical Agency), 2020. The Federal Democratic Republic of Ethiopia Central Statistical Agency. Agricultural Sample Survey, Volume I, Report on Area and Production of Major Crops (Private Peasant Holdings, 2019/2020 Meher Season), Statistical Bulletin 578, Addis Ababa, Ethiopia. |
| [8] | Deresse, H. D. (2019). Soybean research and development in Ethiopia. ASA 3 (10), 192-194. |
| [9] | Hailemariam M., Tesfaye A. Progress of soybean [Glycine max (L.) Merrill] breeding and genetics research in Ethiopia. JNSR. 2018; 8: 70. |
| [10] | IAR (1983). Progress Report on Pulses, Oil crops and Field Crops. Field crops Development, Institute of Agricultural Research. Addis Ababa, Ethiopia. |
| [11] | Awasarmal AB, Soni SB, Diverkar S (2011). Effect of different packaging materials on shelf life of Sapota fruit. |
| [12] | Daniel Markos, Pal UR, Elias Uragie (2012). Dry Matter Partitioning, Nodulation and Seed Traits of Medium and Late Maturing Soybean Varieties as Affected by Planting Pattern and Plant Density. Journal of Agricultural Science and Technology 2: 142-150. |
| [13] | CIMMYT. (1988). from agronomic data to farmer recommendations: An economics-training manual. Completely Revised. Mexico. D. F. |
| [14] | Birhanu Chala, Tolera Abera and Bhupesh Nandeshwar. (2020). Effects of Inter Row and Intra Spacing on Phenology, Growth and Yield of Chickpea (Cicer arietinum L.) In Jimma Horro District, Western Ethiopia. World Journal of Agricultural Sciences 16 (5): 356-367. |
| [15] | Bakry BA, Elewa TA, El-Karamany MF, Zeidan MS, Tawfik MM. (2011). Effect of row spacing on yield and its components of some faba bean varieties under newly reclaimed sandy soil condition. World Journal of Agricultural Science, 7(1): 68-72. |
| [16] | Shamsi, K. and S. Kobraee, 2009. Effect of plant density on the growth, yield and yield components of three soybean varieties under climatic conditions of Kermanshah, Iran. Animal and Plant Sciences Journal, 2(2): 96-99. |
| [17] | Almaz Meseret, Bizuwork Tafes and Sisay Eshetu. (2022). Boosting Chickpea Production by Optimizing Inter-Row and Intra row Spacing at Central Highlands of Ethiopia. Hindawi International Journal of Agronomy. 2022: 1-9. |
| [18] | Kip Cullers. The new soybean record yield of 10414 kg ha-1-Meet the high yield record holder. Soybean Sci. Technol. 2010, 1-4. |
| [19] | Ball, R. A., Purcell, L. C., & Vories, E. D. (2000). Short-season soybean yield compensation in response to population and water regime. Crop Sci., Vol. 40, pp. 1070-1078. |
| [20] | Xu, C.; Li, R.; Song, W.; Wu, T.; Sun, S.; Han, T.; Wu, C. High Density and Uniform Plant Distribution Improve Soybean Yield by Regulating Population Uniformity and Canopy Light Interception. Agronomy 2021, 11, 1880. |
| [21] | Kibiru Kena. Effect of Inter Row Spacing on Yield Components and Yield of Soybean [Glycine Max (L.) Merrill] Varieties in Dale Sedi District, Western Ethiopia. Agri Res& Tech: Open Access J. 2018; 18(4): 556068. |
APA Style
Azanaw, M., Biset, F., Zemene, S., Adugna, G., Kasahun, S., et al. (2025). Determination of Optimum Plant Population for Soybean Agronomic Productivity. International Journal of Biochemistry, Biophysics & Molecular Biology, 10(2), 24-32. https://doi.org/10.11648/j.ijbbmb.20251002.11
ACS Style
Azanaw, M.; Biset, F.; Zemene, S.; Adugna, G.; Kasahun, S., et al. Determination of Optimum Plant Population for Soybean Agronomic Productivity. Int. J. Biochem. Biophys. Mol. Biol. 2025, 10(2), 24-32. doi: 10.11648/j.ijbbmb.20251002.11
@article{10.11648/j.ijbbmb.20251002.11,
  author = {Melaku Azanaw and Fentahun Biset and Sitotaw Zemene and Gizat Adugna and Simachew Kasahun and Yismaw Degnet},
  title = {Determination of Optimum Plant Population for Soybean Agronomic Productivity
},
  journal = {International Journal of Biochemistry, Biophysics & Molecular Biology},
  volume = {10},
  number = {2},
  pages = {24-32},
  doi = {10.11648/j.ijbbmb.20251002.11},
  url = {https://doi.org/10.11648/j.ijbbmb.20251002.11},
  eprint = {https://article.sciencepublishinggroup.com/pdf/10.11648.j.ijbbmb.20251002.11},
  abstract = {The poor agronomic practices, such as seeding rate and inappropriate plant population are the major reasons for low productivity of soybean. A field study did to determine the appropriate row and plant spacings for Soybean productivity and profitability at Metema and west Armachiho districts. Treatments were arranged to five rows (30, 40, 50, 60 and 70 cm) with three plant spacings (5, 10 and 15 cm) comparing with the blanket recommendation (40 cm x 10 cm and 60 cm x 5 cm) and laid out in randomized complete block design with three replications. The Afgat variety was used as planting material and 121 kgha-1 of NPS fertilizer was applied at sowing time. The combined results indicated that; days to 50% flowering, number of branches plant-1, length of productive node, number of seeds pod-1were significant, whereas days to 90% physiological maturity, plant height, number of pods plant-1, hundred seeds weight and grain yield were highly significant (p -1) and net benefit (50,650 ETB/ha) were obtained from the combination of 40 cm row spacing with the 5 cm plant spacing. Whereas, the blanket recommendation (40 cm x 10 cm and 60 cm x 5 cm) gave 3556 kgha-1and 3519 kgha-1, respectively. Therefore, 40 cm the row with 5 cm plant spacing is suggested to be promoted for Soybean production on the low land areas of northwestern Gondar, Ethiopia.},
 year = {2025}
}
TY  - JOUR
T1  - Determination of Optimum Plant Population for Soybean Agronomic Productivity

AU  - Melaku Azanaw
AU  - Fentahun Biset
AU  - Sitotaw Zemene
AU  - Gizat Adugna
AU  - Simachew Kasahun
AU  - Yismaw Degnet
Y1  - 2025/08/18
PY  - 2025
N1  - https://doi.org/10.11648/j.ijbbmb.20251002.11
DO  - 10.11648/j.ijbbmb.20251002.11
T2  - International Journal of Biochemistry, Biophysics & Molecular Biology
JF  - International Journal of Biochemistry, Biophysics & Molecular Biology
JO  - International Journal of Biochemistry, Biophysics & Molecular Biology
SP  - 24
EP  - 32
PB  - Science Publishing Group
SN  - 2575-5862
UR  - https://doi.org/10.11648/j.ijbbmb.20251002.11
AB  - The poor agronomic practices, such as seeding rate and inappropriate plant population are the major reasons for low productivity of soybean. A field study did to determine the appropriate row and plant spacings for Soybean productivity and profitability at Metema and west Armachiho districts. Treatments were arranged to five rows (30, 40, 50, 60 and 70 cm) with three plant spacings (5, 10 and 15 cm) comparing with the blanket recommendation (40 cm x 10 cm and 60 cm x 5 cm) and laid out in randomized complete block design with three replications. The Afgat variety was used as planting material and 121 kgha-1 of NPS fertilizer was applied at sowing time. The combined results indicated that; days to 50% flowering, number of branches plant-1, length of productive node, number of seeds pod-1were significant, whereas days to 90% physiological maturity, plant height, number of pods plant-1, hundred seeds weight and grain yield were highly significant (p -1) and net benefit (50,650 ETB/ha) were obtained from the combination of 40 cm row spacing with the 5 cm plant spacing. Whereas, the blanket recommendation (40 cm x 10 cm and 60 cm x 5 cm) gave 3556 kgha-1and 3519 kgha-1, respectively. Therefore, 40 cm the row with 5 cm plant spacing is suggested to be promoted for Soybean production on the low land areas of northwestern Gondar, Ethiopia.
VL  - 10
IS  - 2
ER  -
Gondar Agricultural Research Centre, Gondar, Ethiopia
Research Fields: agronomist on all plant agronomy
Gondar Agricultural Research Centre, Gondar, Ethiopia
Research Fields: agronomist on all plant agronomy
Gondar Agricultural Research Centre, Gondar, Ethiopia
Research Fields: assistant researcher in plant science
Gondar Agricultural Research Centre, Gondar, Ethiopia
Research Fields: assistant researcher in plant science
Gondar Agricultural Research Centre, Gondar, Ethiopia
Research Fields: assistant researcher in plant science
Gondar Agricultural Research Centre, Gondar, Ethiopia
Research Fields: breeder in plant science